
可视化
函数 draw_geometries
Section titled “函数 draw_geometries”Open3D 提供了一个便捷的可视化函数 draw_geometries,它接收一个几何对象(Geometry)列表(PointCloud、TriangleMesh 或 Image),并将它们一起渲染。我们在可视化器中实现了许多功能,例如通过鼠标操作进行旋转、平移和缩放,更改渲染样式以及屏幕截图等。在窗口内按 H 键可打印出完整的功能列表。
print("Load a ply point cloud, print it, and render it")sample_ply_data = o3d.data.PLYPointCloud()pcd = o3d.io.read_point_cloud(sample_ply_data.path)o3d.visualization.draw_geometries([pcd], zoom=0.3412, front=[0.4257, -0.2125, -0.8795], lookat=[2.6172, 2.0475, 1.532], up=[-0.0694, -0.9768, 0.2024])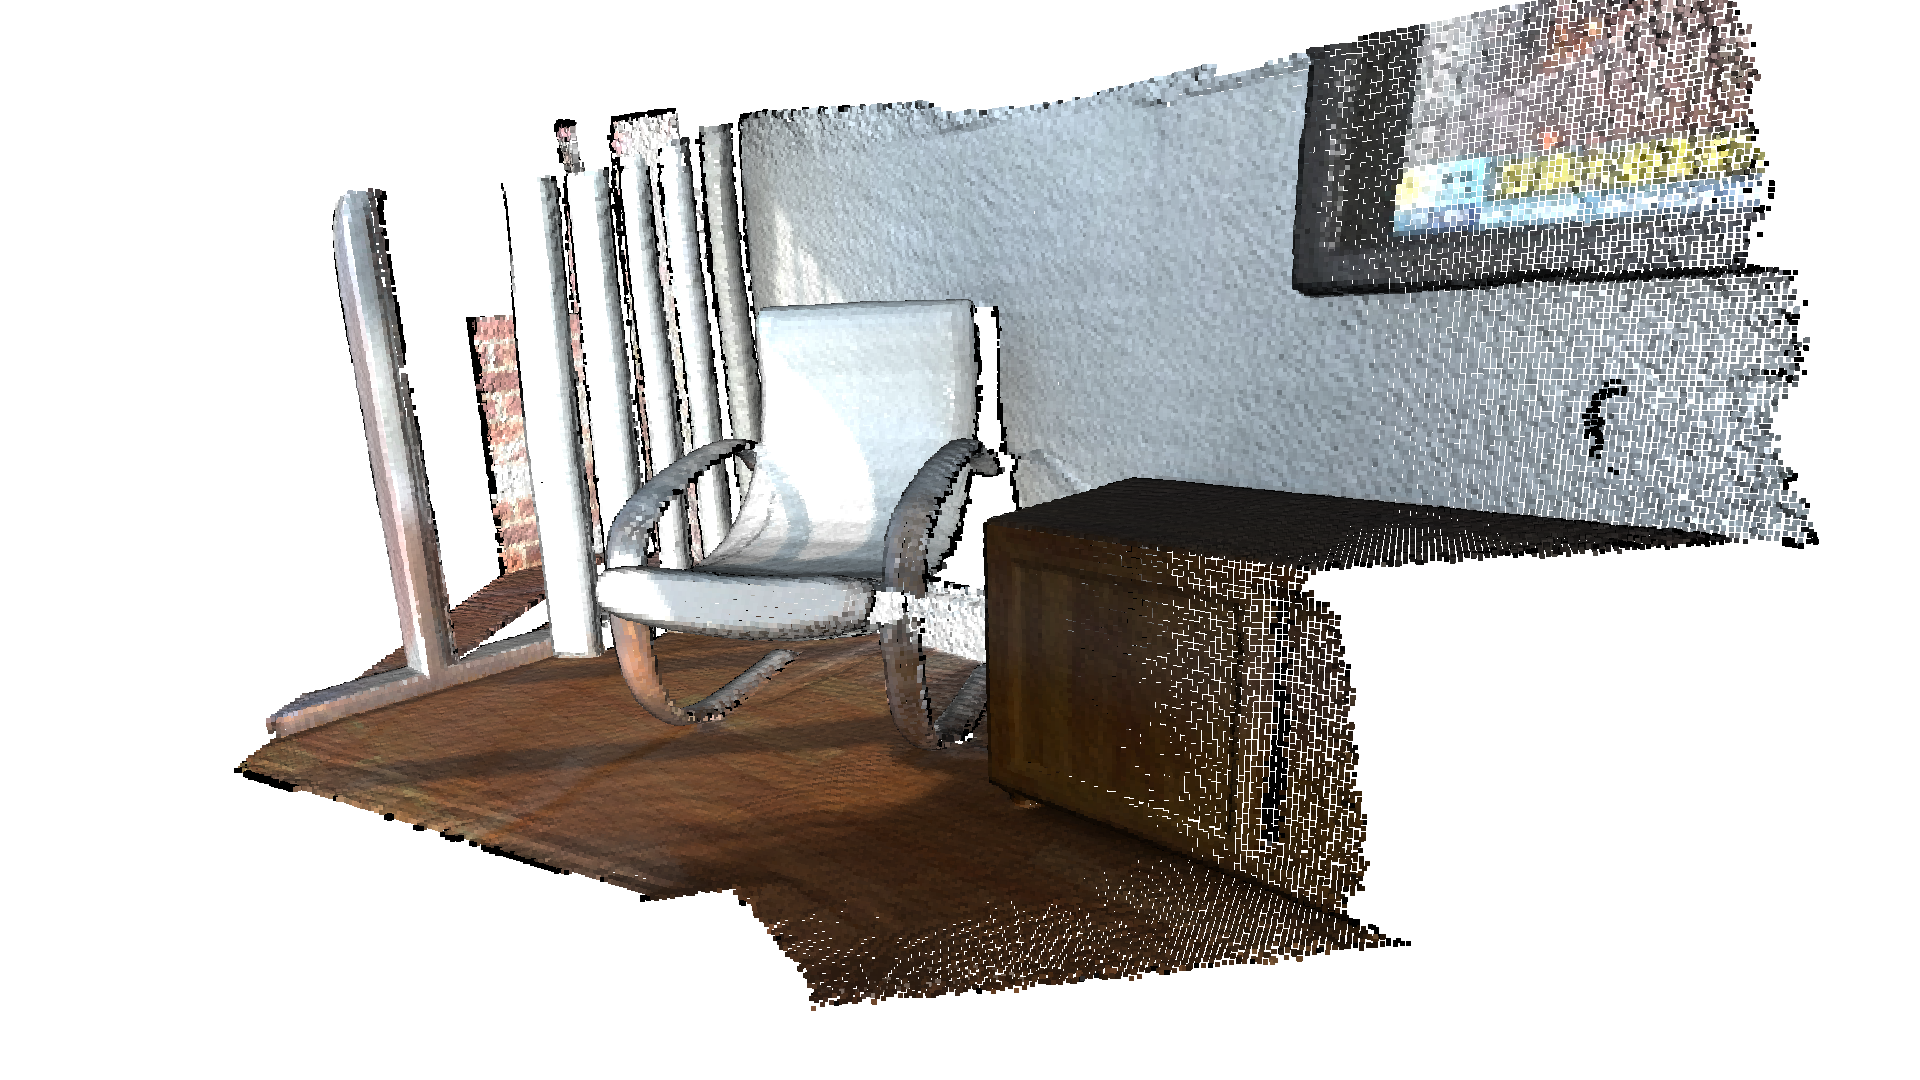
输出:
Load a ply point cloud, print it, and render it[Open3D WARNING] GLFW Error: Failed to detect any supported platform[Open3D WARNING] GLFW initialized for headless rendering.-- Mouse view control -- Left button + drag : Rotate. Ctrl + left button + drag : Translate. Wheel button + drag : Translate. Shift + left button + drag : Roll. Wheel : Zoom in/out.
-- Keyboard view control -- [/] : Increase/decrease field of view. R : Reset view point. Ctrl/Cmd + C : Copy current view status into the clipboard. Ctrl/Cmd + V : Paste view status from clipboard.
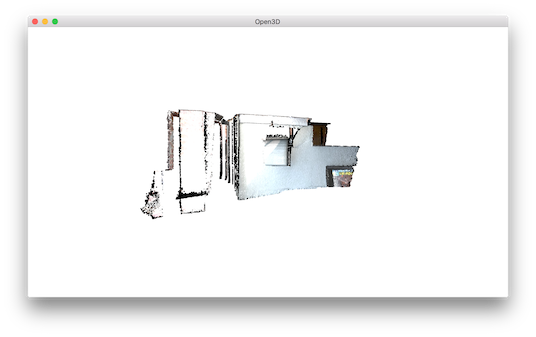
-- General control -- Q, Esc : Exit window. H : Print help message. P, PrtScn : Take a screen capture. D : Take a depth capture. O : Take a capture of current rendering settings.初始时,点云被上下颠倒地渲染出来。
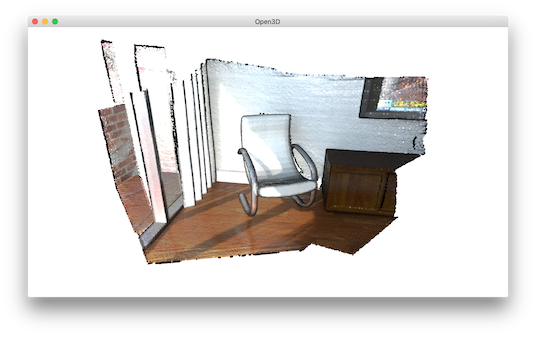
使用左键单击并拖拽调整视角后,我们可以得到一个更好的观察角度。
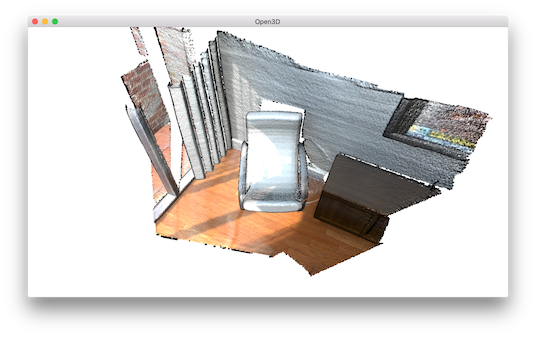
要保留这个视角,请按 Ctrl + C。视角会被转换为一段 JSON 字符串并存入剪贴板。当你把相机移动到其他视角后,例如:
此时按 Ctrl + V 即可回到原来的视角。
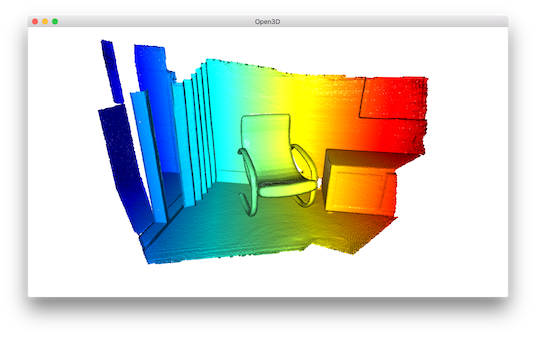
Open3D 可视化器支持多种渲染样式(Rendering style)。例如,按 L 键可在 Phong 光照(Phong lighting)与简单的纯色渲染之间切换。按 2 键则会使点根据其 x 坐标进行着色。
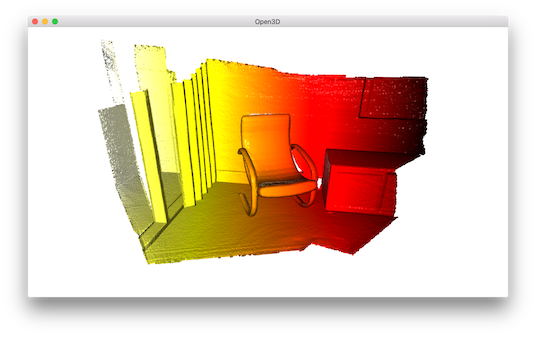
颜色映射(Color map)也可以调整,例如按 Shift + 4 即可把 jet 颜色映射切换为 hot 颜色映射。
下面的代码使用 create_box、create_sphere 和 create_cylinder 分别生成了一个立方体、一个球体和一个圆柱体。其中立方体被涂成红色,球体被涂成蓝色,圆柱体被涂成绿色。所有网格(mesh)都计算了法向量以支持 Phong 着色(参见《可视化 3D 网格》与《表面法向量估计》)。我们甚至可以用 create_coordinate_frame 创建一个坐标轴,并将其原点设在 (-2, -2, -2)。
print("Let's define some primitives")mesh_box = o3d.geometry.TriangleMesh.create_box(width=1.0, height=1.0, depth=1.0)mesh_box.compute_vertex_normals()mesh_box.paint_uniform_color([0.9, 0.1, 0.1])mesh_sphere = o3d.geometry.TriangleMesh.create_sphere(radius=1.0)mesh_sphere.compute_vertex_normals()mesh_sphere.paint_uniform_color([0.1, 0.1, 0.7])mesh_cylinder = o3d.geometry.TriangleMesh.create_cylinder(radius=0.3, height=4.0)mesh_cylinder.compute_vertex_normals()mesh_cylinder.paint_uniform_color([0.1, 0.9, 0.1])mesh_frame = o3d.geometry.TriangleMesh.create_coordinate_frame( size=0.6, origin=[-2, -2, -2])输出:
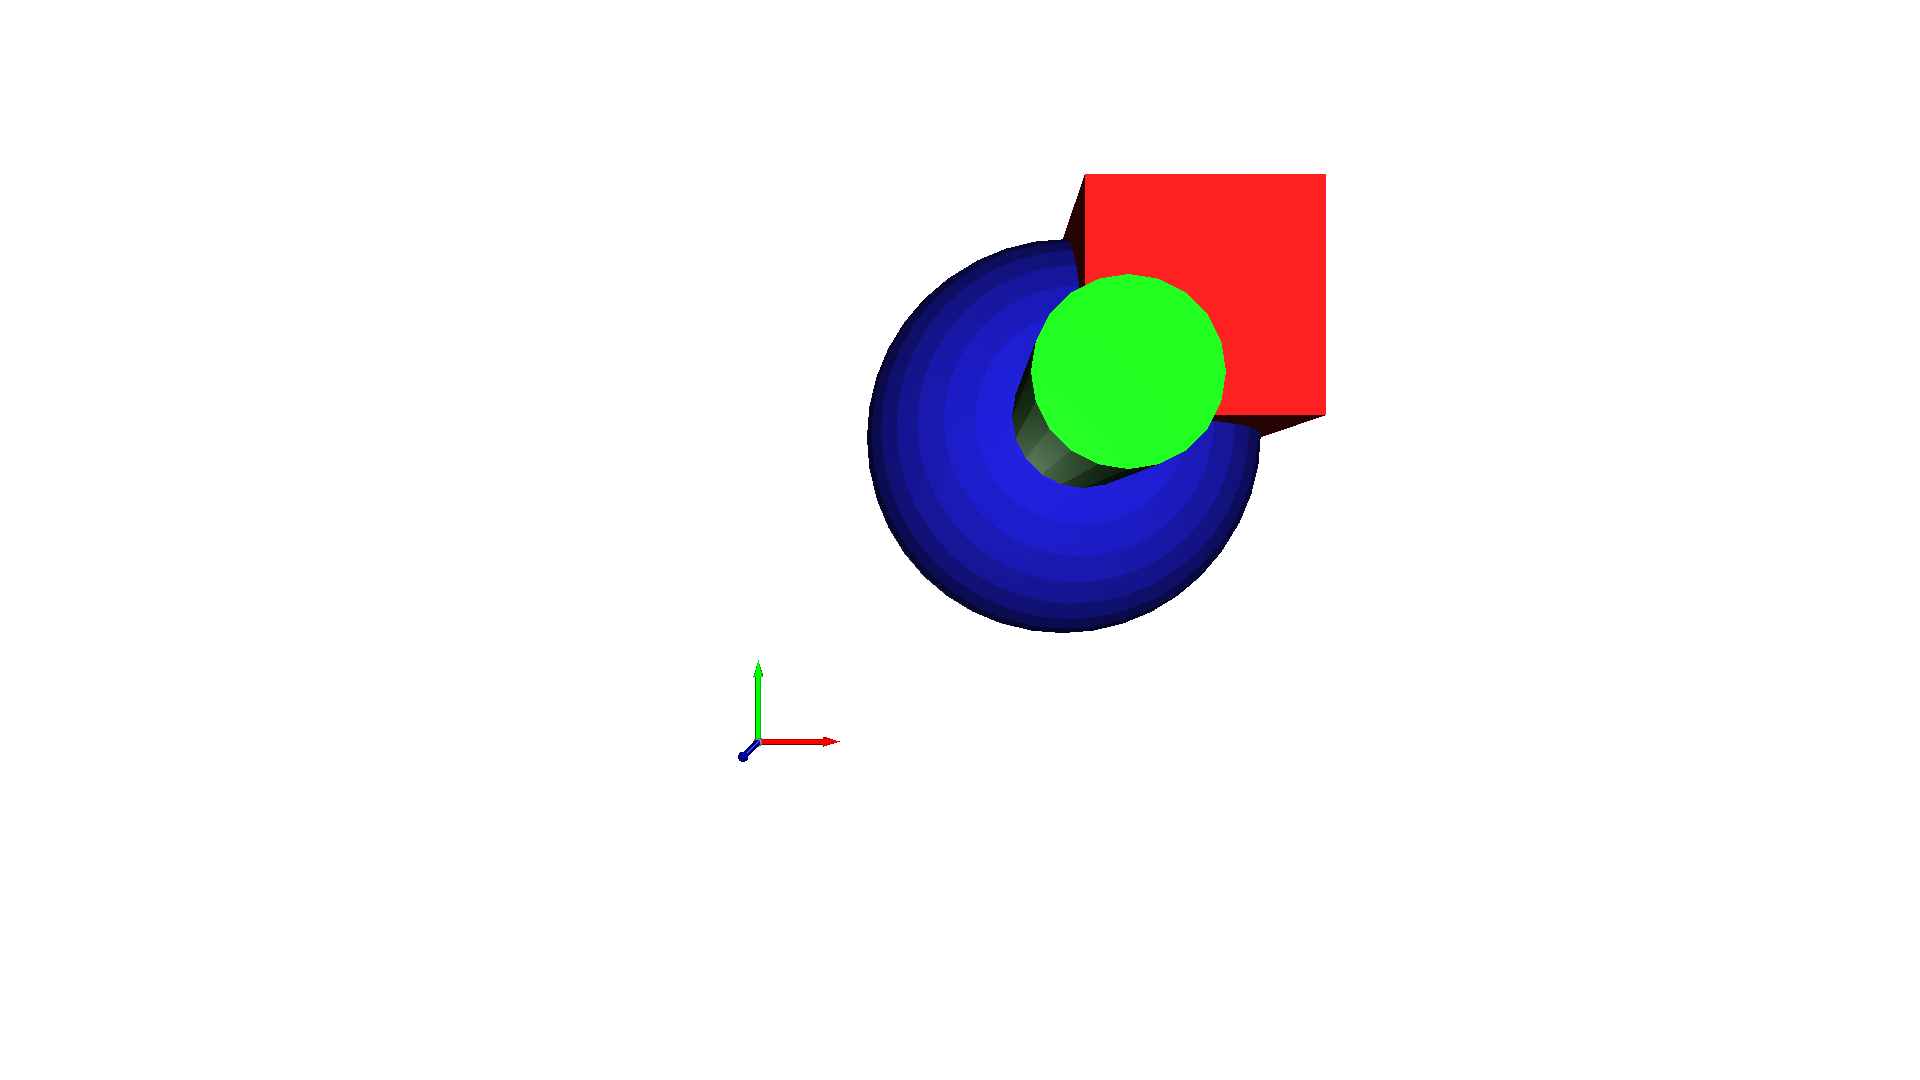
Let's define some primitivesdraw_geometries 接收一个几何体列表,并将它们一并渲染。另外,TriangleMesh 支持 + 运算符,可以把多个网格合并为一个。我们推荐第一种方式,因为它支持不同类型几何体的组合(例如,一个网格可以与一个点云一起渲染)。
print("We draw a few primitives using collection.")o3d.visualization.draw_geometries(    [mesh_box, mesh_sphere, mesh_cylinder, mesh_frame])
print("We draw a few primitives using + operator of mesh.")o3d.visualization.draw_geometries(    [mesh_box + mesh_sphere + mesh_cylinder + mesh_frame])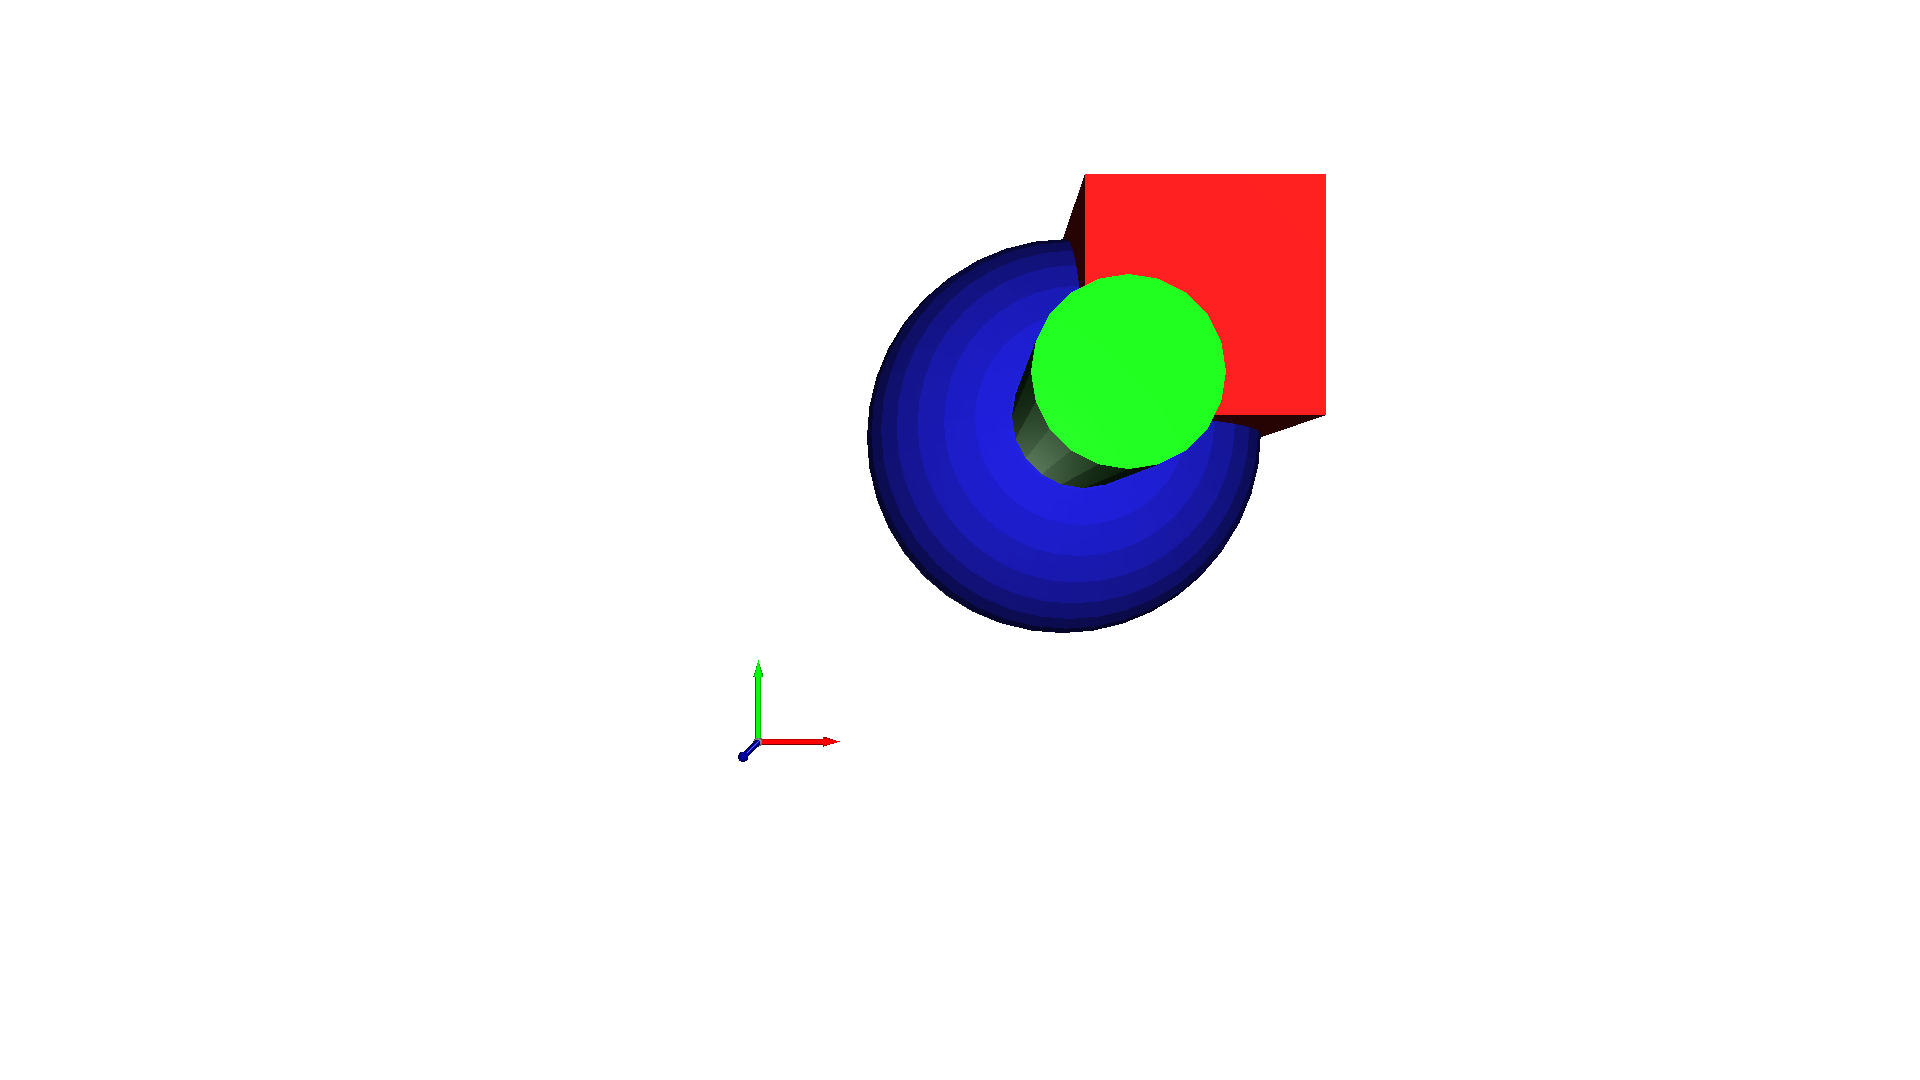
输出:
We draw a few primitives using collection.[Open3D WARNING] GLFW initialized for headless rendering.We draw a few primitives using + operator of mesh.[Open3D WARNING] GLFW initialized for headless rendering.要绘制线段,需要用一个点集和一个边集(点索引构成的点对)来定义一个 LineSet。下面的示例创建了自定义的点和边(表示为 lines)来构造一个立方体。颜色是可选的——本例中为每条边指定了红色 [1, 0, 0]。
print("Let's draw a box using o3d.geometry.LineSet.")points = [ [0, 0, 0], [1, 0, 0], [0, 1, 0], [1, 1, 0], [0, 0, 1], [1, 0, 1], [0, 1, 1], [1, 1, 1],]lines = [ [0, 1], [0, 2], [1, 3], [2, 3], [4, 5], [4, 6], [5, 7], [6, 7], [0, 4], [1, 5], [2, 6], [3, 7],]colors = [[1, 0, 0] for i in range(len(lines))]line_set = o3d.geometry.LineSet( points=o3d.utility.Vector3dVector(points), lines=o3d.utility.Vector2iVector(lines),)line_set.colors = o3d.utility.Vector3dVector(colors)o3d.visualization.draw_geometries([line_set])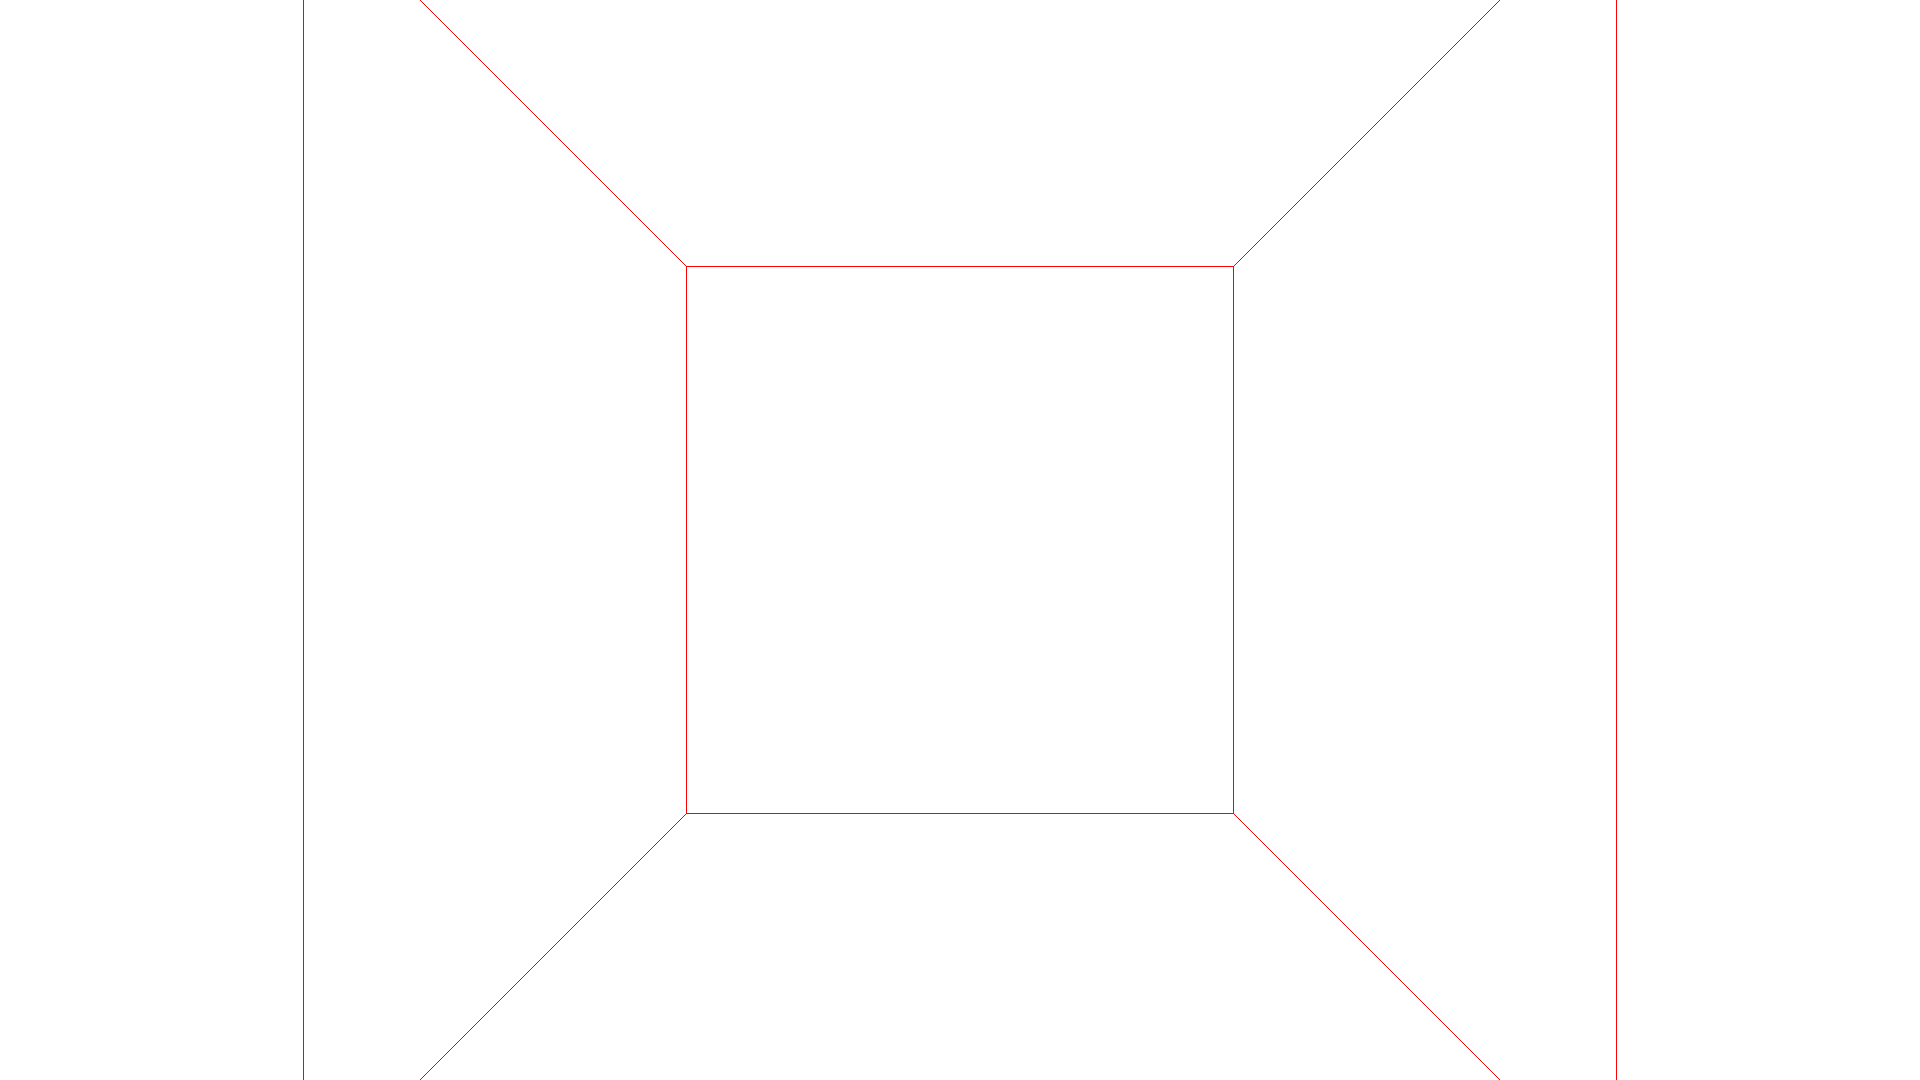
输出:
Let's draw a box using o3d.geometry.LineSet.[Open3D WARNING] GLFW initialized for headless rendering.